Législatives 2017
Second tour
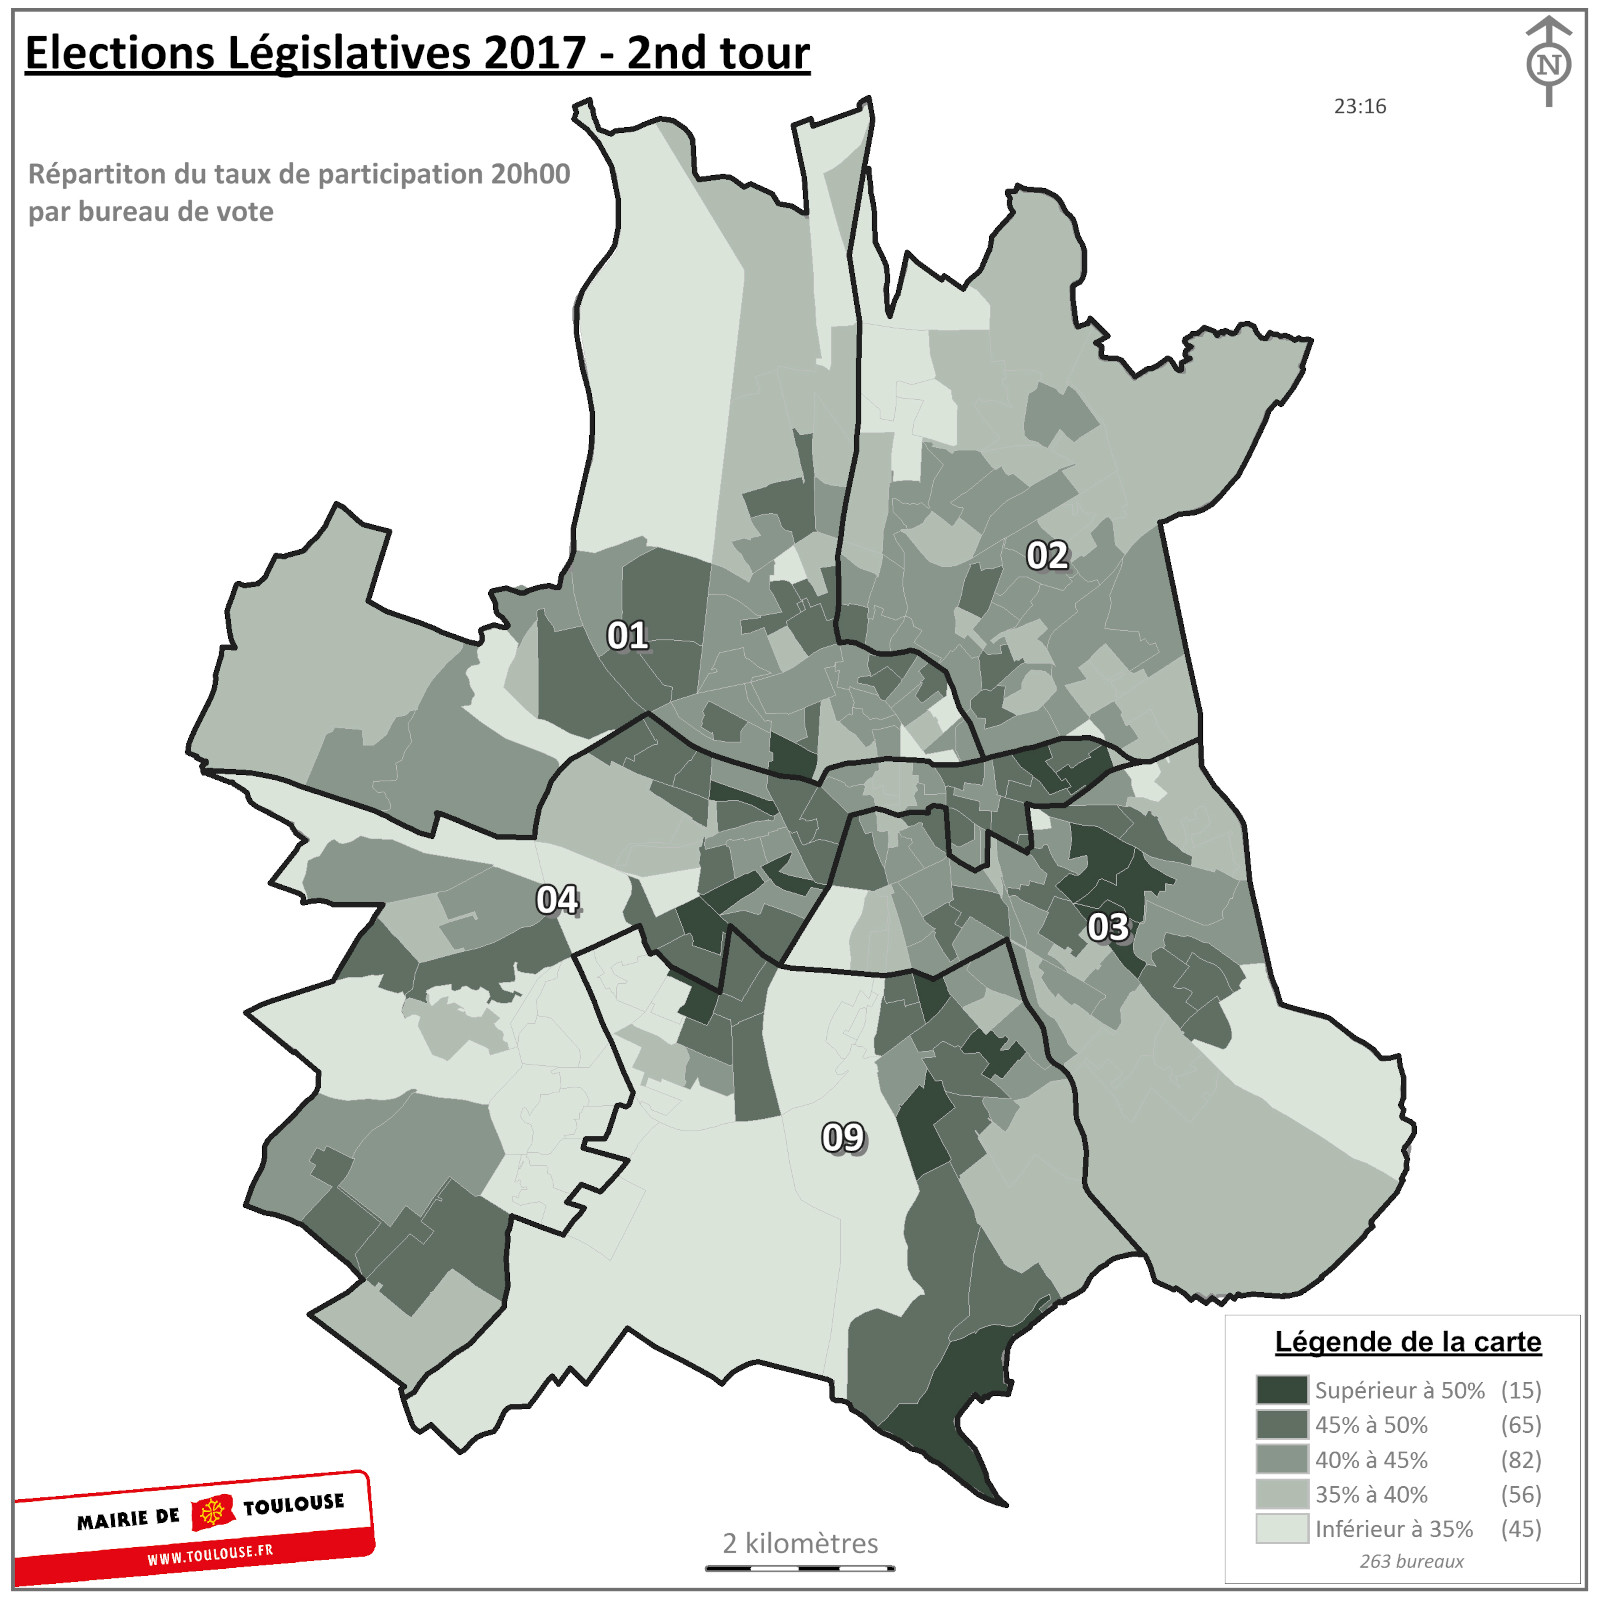
Les résultats à Toulouse, par circonscription et par bureau de vote
Dépouillement des bureaux de vote de Toulouse
Résultats : 263 sur 263 bureaux de vote dépouillés
| Inscrits | Votants | Blancs | Nuls | Exprimés | Participation |
|---|---|---|---|---|---|
| 262 114 | 107 226 | 7 373 | 2 765 | 97 088 | 40,91 % |
| Inscrits | 262 114 | ||||
| Votants | 107 226 | ||||
| Blancs | 7 373 | ||||
| Nuls | 2 765 | ||||
| Exprimés | 97 088 | ||||
| Participation | 40,91 % |
Les résultats publiés par circonscription concernent uniquement les résultats sur le territoire de Toulouse. Pour connaître les résultats définitifs par circonscription, cliquez ici.
Aucun résultat n'est disponible pour le moment.
Dépouillement des bureaux de vote de Toulouse
Résultats : 263 sur 263 bureaux de vote dépouillés
| Inscrits | Votants | Blancs | Nuls | Exprimés | Participation |
|---|---|---|---|---|---|
| 262 114 | 107 226 | 7 373 | 2 765 | 97 088 | 40,91 % |
| Inscrits | 262 114 | ||||
| Votants | 107 226 | ||||
| Blancs | 7 373 | ||||
| Nuls | 2 765 | ||||
| Exprimés | 97 088 | ||||
| Participation | 40,91 % |
Vous pouvez consulter les résultats détaillés par bureau de vote toulousain via l'onglet "Bureaux de vote" présent ci-dessus.
| Votants | Participation | |
|---|---|---|
| 11h30 | 38 267 | 14,60 % |
| 16h30 | 72 694 | 27,73 % |
| 18h00 | 85 891 | 32,77 % |
| 20h00 | 107 226 | 40,91 % |
Dépouillement des bureaux de vote de Toulouse
Résultats : 263 sur 263 bureaux de vote dépouillés
| Inscrits | Votants | Blancs | Nuls | Exprimés | Participation |
|---|---|---|---|---|---|
| 262 114 | 107 226 | 7 373 | 2 765 | 97 088 | 40,91 % |
| Inscrits | 262 114 | ||||
| Votants | 107 226 | ||||
| Blancs | 7 373 | ||||
| Nuls | 2 765 | ||||
| Exprimés | 97 088 | ||||
| Participation | 40,91 % |
Aucun résultat n'est disponible pour le moment.