Dépouillement des bureaux de vote de Toulouse
Résultats :
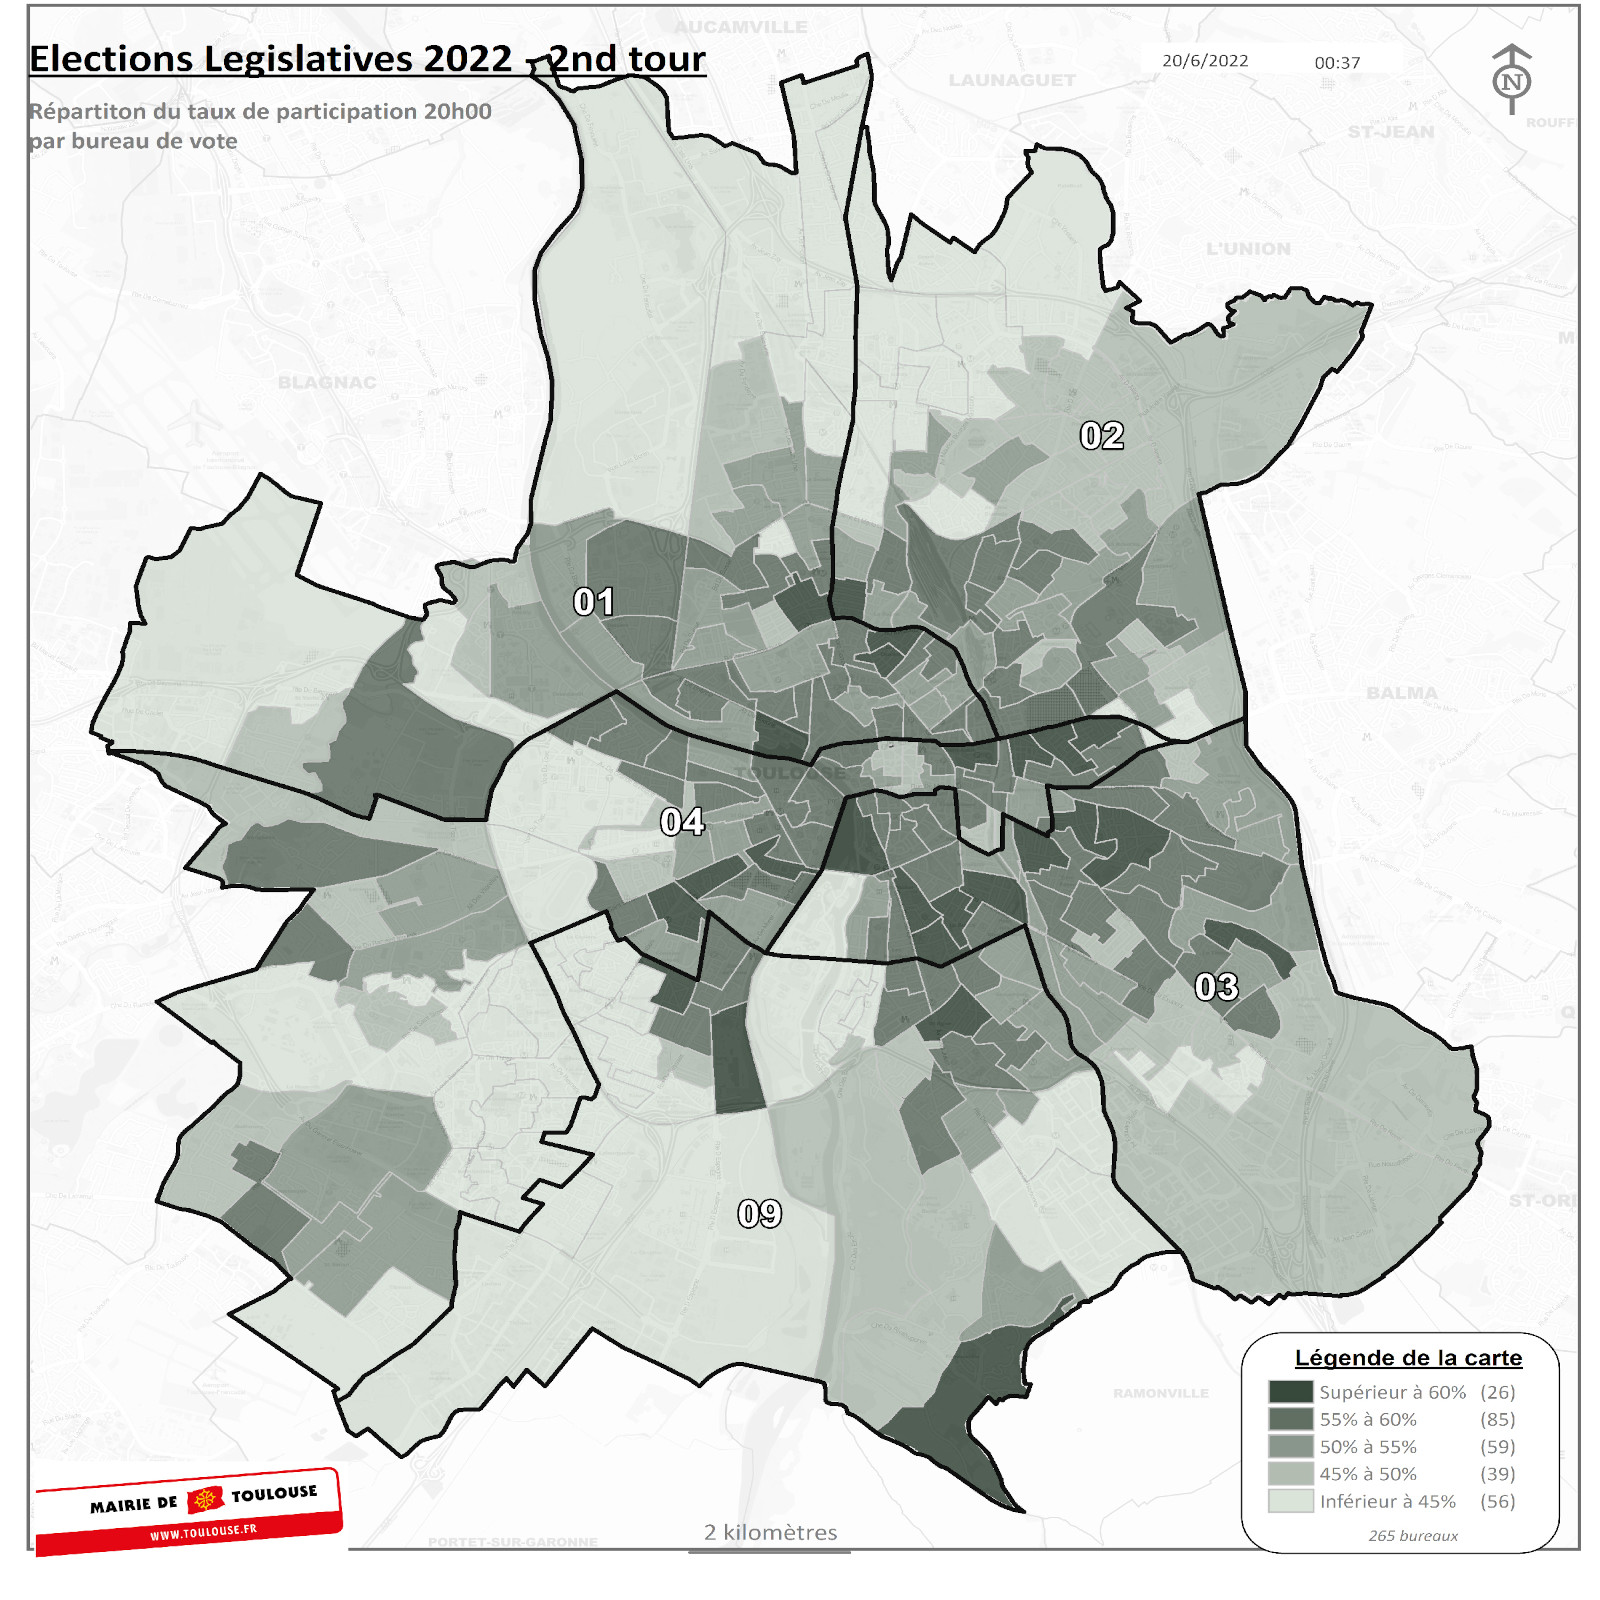
265 sur 265 bureaux de vote dépouillés
Inscrits
Votants
Blancs
Nuls
Exprimés
Participation
262 188
133 883
4 509
1 870
127 504
51,06 %
Inscrits
262 188
Votants
133 883
Blancs
4 509
Nuls
1 870
Exprimés
127 504
Participation
51,06 %
Les résultats publiés par circonscription concernent uniquement les résultats sur le territoire de Toulouse.
Pour connaître les résultats définitifs par circonscription, cliquez ici .
Choix de la circonscription :
Résultats disponibles pour
CIRCONSCRIPTION 1
CIRCONSCRIPTION 2
CIRCONSCRIPTION 3
CIRCONSCRIPTION 4
CIRCONSCRIPTION 9
Dépouillement des bureaux de vote de Toulouse
Résultats :
265 sur 265 bureaux de vote dépouillés
Inscrits
Votants
Blancs
Nuls
Exprimés
Participation
262 188
133 883
4 509
1 870
127 504
51,06 %
Inscrits
262 188
Votants
133 883
Blancs
4 509
Nuls
1 870
Exprimés
127 504
Participation
51,06 %
Vous pouvez consulter les résultats détaillés par bureau de vote toulousain via l'onglet "Bureaux de vote" présent ci-dessus.
Votants
Participation
11h30
47 150
17,98 %
16h30
90 918
34,68 %
20h00
133 883
51,06 %
Dépouillement des bureaux de vote de Toulouse
Résultats :
265 sur 265 bureaux de vote dépouillés
Inscrits
Votants
Blancs
Nuls
Exprimés
Participation
262 188
133 883
4 509
1 870
127 504
51,06 %
Inscrits
262 188
Votants
133 883
Blancs
4 509
Nuls
1 870
Exprimés
127 504
Participation
51,06 %
Choix du bureau de vote :
Résultats définitifs disponibles pour
00001 - HOTEL DE VILLE - SALLE DES COMMISSIONS
0001A - BUREAU DE RATTACHEMENT DÉROGATOIRE
00002 - HOTEL DE VILLE - SALLE DES COMMISSIONS
00003 - ECOLE LAKANAL
00004 - ECOLE LAKANAL
00005 - MATERNELLE SERMET
00006 - MATERNELLE SERMET
00007 - MATERNELLE SERMET
00008 - ECOLE DU NORD
00009 - ECOLE DU NORD
00010 - ECOLE DU NORD
00011 - ECOLE DU NORD
00012 - ECOLE DU NORD
00013 - ECOLE BAYARD
00014 - ECOLE BAYARD
00015 - ECOLE BAYARD
00016 - ECOLE BAYARD
00017 - ECOLE BAYARD
00018 - CENTRE SPORTIF LEO LAGRANGE
00019 - CENTRE SPORTIF LEO LAGRANGE
00020 - ECOLE BONNEFOY
00021 - ECOLE BONNEFOY
00022 - ECOLE BONNEFOY
00023 - ECOLE BONNEFOY
00024 - ESPACE BONNEFOY PERIOLE
00025 - ESPACE BONNEFOY PERIOLE
00026 - ESPACE BONNEFOY PERIOLE
00027 - ECOLE PIERRE ET MARIE CURIE
00028 - ECOLE PIERRE ET MARIE CURIE
00029 - ECOLE PIERRE ET MARIE CURIE
00030 - ECOLE PIERRE ET MARIE CURIE
00031 - ECOLE FOURTANIER
00032 - ECOLE FOURTANIER
00033 - ECOLE FOURTANIER
00034 - ECOLE FOURTANIER
00035 - ECOLE MICHELET
00036 - ECOLE MICHELET
00037 - ECOLE MICHELET
00038 - ECOLE MICHELET
00039 - ECOLE MICHELET
00040 - ECOLE CALVINHAC
00041 - ECOLE CALVINHAC
00042 - GROUPE SCOLAIRE BONHOURE
00043 - GROUPE SCOLAIRE BONHOURE
00044 - GROUPE SCOLAIRE BONHOURE
00045 - GROUPE SCOLAIRE BONHOURE
00046 - GROUPE SCOLAIRE BONHOURE
00047 - GROUPE SCOLAIRE BONHOURE
00048 - ECOLE JEAN JAURES
00049 - ECOLE JEAN JAURES
00050 - ECOLE JEAN JAURES
00051 - ECOLE JEAN JAURES
00052 - ECOLE JEAN JAURES
00053 - ECOLE JEAN JAURES
00054 - ECOLE PIERRE DUPONT
00055 - ECOLE PIERRE DUPONT
00056 - ECOLE PIERRE DUPONT
00057 - ECOLE PIERRE DUPONT
00058 - ECOLE FABRE
00059 - ECOLE FABRE
00060 - ECOLE FABRE
00061 - ECOLE FABRE
00062 - ECOLE FABRE
00063 - ECOLE FABRE
00064 - ECOLE SAUZELONG
00065 - ECOLE SAUZELONG
00066 - ECOLE SAUZELONG
00067 - ECOLE RICARDIE 3
00068 - ECOLE RICARDIE 3
00069 - ECOLE RICARDIE 3
0069A - ECOLE RICARDIE 3
00070 - ECOLE ANDRE DASTE
00071 - ECOLE ANDRE DASTE
00072 - ECOLE ANDRE DASTE
00073 - ECOLE ANDRE DASTE
00074 - MATERNELLE LEO LAGRANGE
00075 - MATERNELLE LEO LAGRANGE
00076 - ECOLE JULES JULIEN
00077 - ECOLE JULES JULIEN
00078 - ECOLE JULES JULIEN
00079 - ECOLE JULES JULIEN
00080 - ECOLE JULES JULIEN
00081 - ECOLE JULES JULIEN
0081A - ECOLE JULES JULIEN
00082 - ECOLE LE PASTEL
00083 - ECOLE LE PASTEL
0083A - ECOLE LE PASTEL
00084 - ECOLE MAURICE BECANNE
00085 - ECOLE MAURICE BECANNE
00086 - ECOLE MAURICE JACQUIER
00087 - ECOLE MAURICE JACQUIER
00088 - ECOLE MAURICE JACQUIER
00089 - ECOLE MAURICE JACQUIER
00090 - ECOLE LES OUSTALOUS
00091 - ECOLE BUFFON
00092 - ECOLE BUFFON
00093 - ECOLE BUFFON
00094 - ECOLE SYLVAIN DAURIAC
00095 - ECOLE SYLVAIN DAURIAC
00096 - ECOLE SYLVAIN DAURIAC
00097 - CSC ALBAN MINVILLE
00098 - CSC ALBAN MINVILLE
00099 - CSC ALBAN MINVILLE
00100 - MATERNELLE DIDIER DAURAT
00101 - MATERNELLE DIDIER DAURAT
00102 - MATERNELLE DIDIER DAURAT
00103 - MATERNELLE DIDIER DAURAT
00104 - MATERNELLE LES VERGERS
00105 - MATERNELLE LES VERGERS
00106 - MATERNELLE LES VERGERS
00107 - ECOLE PAUL BERT
00108 - ECOLE PAUL BERT
00109 - ECOLE PAUL BERT
00110 - ECOLE PAUL BERT
00111 - ECOLE PAUL BERT
00112 - ECOLE PAUL BERT
0112A - ECOLE PAUL BERT
00113 - ECOLE MOLIERE
00114 - ECOLE MOLIERE
00115 - ECOLE MOLIERE
00116 - ECOLE MOLIERE
00117 - ECOLE PATTE D OIE
00118 - ECOLE PATTE D OIE
00119 - ECOLE PATTE D OIE
00120 - ECOLE PATTE D OIE
00121 - ECOLE PATTE D OIE
00122 - ECOLE PATTE D OIE
00123 - ECOLE PATTE D OIE
00124 - ECOLE ETIENNE BILLIERES
00125 - ECOLE ETIENNE BILLIERES
00126 - ECOLE ETIENNE BILLIERES
00127 - ECOLE ETIENNE BILLIERES
00128 - ECOLE ETIENNE BILLIERES
00129 - ECOLE FONTAINE BAYONNE
00130 - ECOLE FONTAINE BAYONNE
00131 - ECOLE GEORGES HYON
00132 - ECOLE GEORGES HYON
00133 - ECOLE GEORGES HYON
00134 - GROUPE SCOLAIRE VIOLLET LE DUC
00135 - GROUPE SCOLAIRE VIOLLET LE DUC
00136 - GROUPE SCOLAIRE VIOLLET LE DUC
00137 - FOYER DU 3 EME AGE
00138 - ECOLE LARDENNE
00139 - ECOLE LARDENNE
00140 - ECOLE LARDENNE
00141 - ECOLE LESPINASSE
00142 - ECOLE LESPINASSE
00143 - ECOLE LESPINASSE
00144 - GROUPE SCOLAIRE LITTRE
00145 - GROUPE SCOLAIRE LITTRE
00146 - GROUPE SCOLAIRE LITTRE
00147 - ECOLE ELEMENTAIRE FLEURANCE
00148 - ECOLE ELEMENTAIRE FLEURANCE
00149 - ECOLE DES GAIS PINSONS
00150 - ECOLE DES GAIS PINSONS
00151 - ECOLE DES GAIS PINSONS
00152 - ECOLE DES GAIS PINSONS
00153 - ECOLE DES GAIS PINSONS
00154 - ECOLE AMIDONNIERS
00155 - ECOLE AMIDONNIERS
00156 - ECOLE AMIDONNIERS
00157 - MAISON DE LA CITOYENNETE NORD
00158 - MAISON DE LA CITOYENNETE NORD
00159 - MAISON DE LA CITOYENNETE NORD
00160 - MAISON DE LA CITOYENNETE NORD
00161 - ECOLE ALFRED DE MUSSET
00162 - ECOLE ALFRED DE MUSSET
00163 - ECOLE ALFRED DE MUSSET
00164 - ECOLE ALFRED DE MUSSET
00165 - MATERNELLE PONTS JUMEAUX
00166 - MATERNELLE PONTS JUMEAUX
00167 - ECOLE FALGUIERE
00168 - ECOLE FALGUIERE
00169 - ECOLE FALGUIERE
00170 - ECOLE FALGUIERE
00171 - ECOLE DES SEPT DENIERS
00172 - ECOLE DES SEPT DENIERS
00173 - ECOLE DES SEPT DENIERS
00174 - ECOLE DES SEPT DENIERS
00175 - GROUPE SCOLAIRE CHATEAU ANCELY
00176 - GROUPE SCOLAIRE CHATEAU ANCELY
00177 - GROUPE SCOLAIRE CHATEAU ANCELY
00178 - GROUPE SCOLAIRE CHATEAU ANCELY
00179 - ECOLE JULES FERRY
00180 - ECOLE JULES FERRY
00181 - ECOLE JULES FERRY
00182 - ECOLE JULES FERRY
0182A - ECOLE JULES FERRY
00183 - ECOLE LALANDE
00184 - ECOLE LALANDE
00185 - ECOLE LALANDE
00186 - ECOLE LALANDE
00187 - MATERNELLE JEAN DIEUZAIDE
00188 - MAISON DE QUARTIER DU GRAND SELVE
0188A - MAISON DE QUARTIER DU GRAND SELVE
00189 - ECOLE ERNEST RENAN
00190 - ECOLE ERNEST RENAN
00191 - ECOLE ERNEST RENAN
00192 - ECOLE ERNEST RENAN
0192A - ECOLE ERNEST RENAN
00193 - ECOLE CUVIER
00194 - ECOLE CUVIER
00195 - ECOLE CUVIER
00196 - ECOLE CUVIER
00197 - ECOLE CUVIER
00198 - ECOLE CUVIER
0198A - ECOLE CUVIER
00199 - ECOLE LA MAOURINE
00200 - ECOLE LA MAOURINE
00201 - ECOLE LA MAOURINE
00202 - MATERNELLE REILLE
00203 - MATERNELLE REILLE
00204 - MATERNELLE REILLE
00205 - MATERNELLE REILLE
00206 - ECOLE MICHOUN
00207 - ECOLE MICHOUN
00208 - ECOLE MICHOUN
00209 - ECOLE MICHOUN
00210 - ECOLE MICHOUN
00211 - ECOLE MICHOUN
00212 - ECOLE LA JUNCASSE
00213 - ECOLE LA JUNCASSE
00214 - ECOLE LA JUNCASSE
00215 - ECOLE LA JUNCASSE
00216 - ECOLE LA JUNCASSE
00217 - ECOLE LA JUNCASSE
00218 - ECOLE SOUPETARD
00219 - ECOLE SOUPETARD
00220 - ECOLE SOUPETARD
00221 - ECOLE SOUPETARD
00222 - ECOLE ARMAND LEYGUE
00223 - ECOLE ARMAND LEYGUE
00224 - ECOLE ARMAND LEYGUE
00225 - ECOLE ARMAND LEYGUE
00226 - ECOLE ARMAND LEYGUE
00227 - ECOLE ARMAND LEYGUE
00228 - ECOLE ARMAND LEYGUE
00229 - ECOLE JEAN MACE
00230 - ECOLE JEAN MACE
00231 - ECOLE JEAN MACE
00232 - ECOLE JEAN MACE
00233 - ECOLE JEAN CHAUBET
00234 - ECOLE JEAN CHAUBET
00235 - ECOLE CHATEAU DE L HERS
00236 - ECOLE CHATEAU DE L HERS
00237 - ECOLE CHATEAU DE L HERS
00238 - ECOLE CHATEAU DE L HERS
00239 - ECOLE HENRI GUILLAUMET
00240 - ECOLE HENRI GUILLAUMET
00241 - ECOLE HENRI GUILLAUMET
00242 - ECOLE HENRI GUILLAUMET
00243 - ECOLE HENRI GUILLAUMET
00244 - ECOLE LA TERRASSE
00245 - ECOLE LA TERRASSE
00246 - ECOLE LA TERRASSE
00247 - ECOLE LA TERRASSE
00248 - ECOLE LA TERRASSE
00249 - GROUPE SCOLAIRE ANATOLE FRANCE
00250 - GROUPE SCOLAIRE ANATOLE FRANCE
00251 - GROUPE SCOLAIRE ANATOLE FRANCE
00252 - GROUPE SCOLAIRE ANATOLE FRANCE
00253 - GROUPE SCOLAIRE ANATOLE FRANCE
00254 - GROUPE SCOLAIRE ANATOLE FRANCE
00255 - GROUPE SCOLAIRE ANATOLE FRANCE
00256 - GROUPE SCOLAIRE ANATOLE FRANCE