Retour
Municipales 2026

Municipales 2026
Second tour
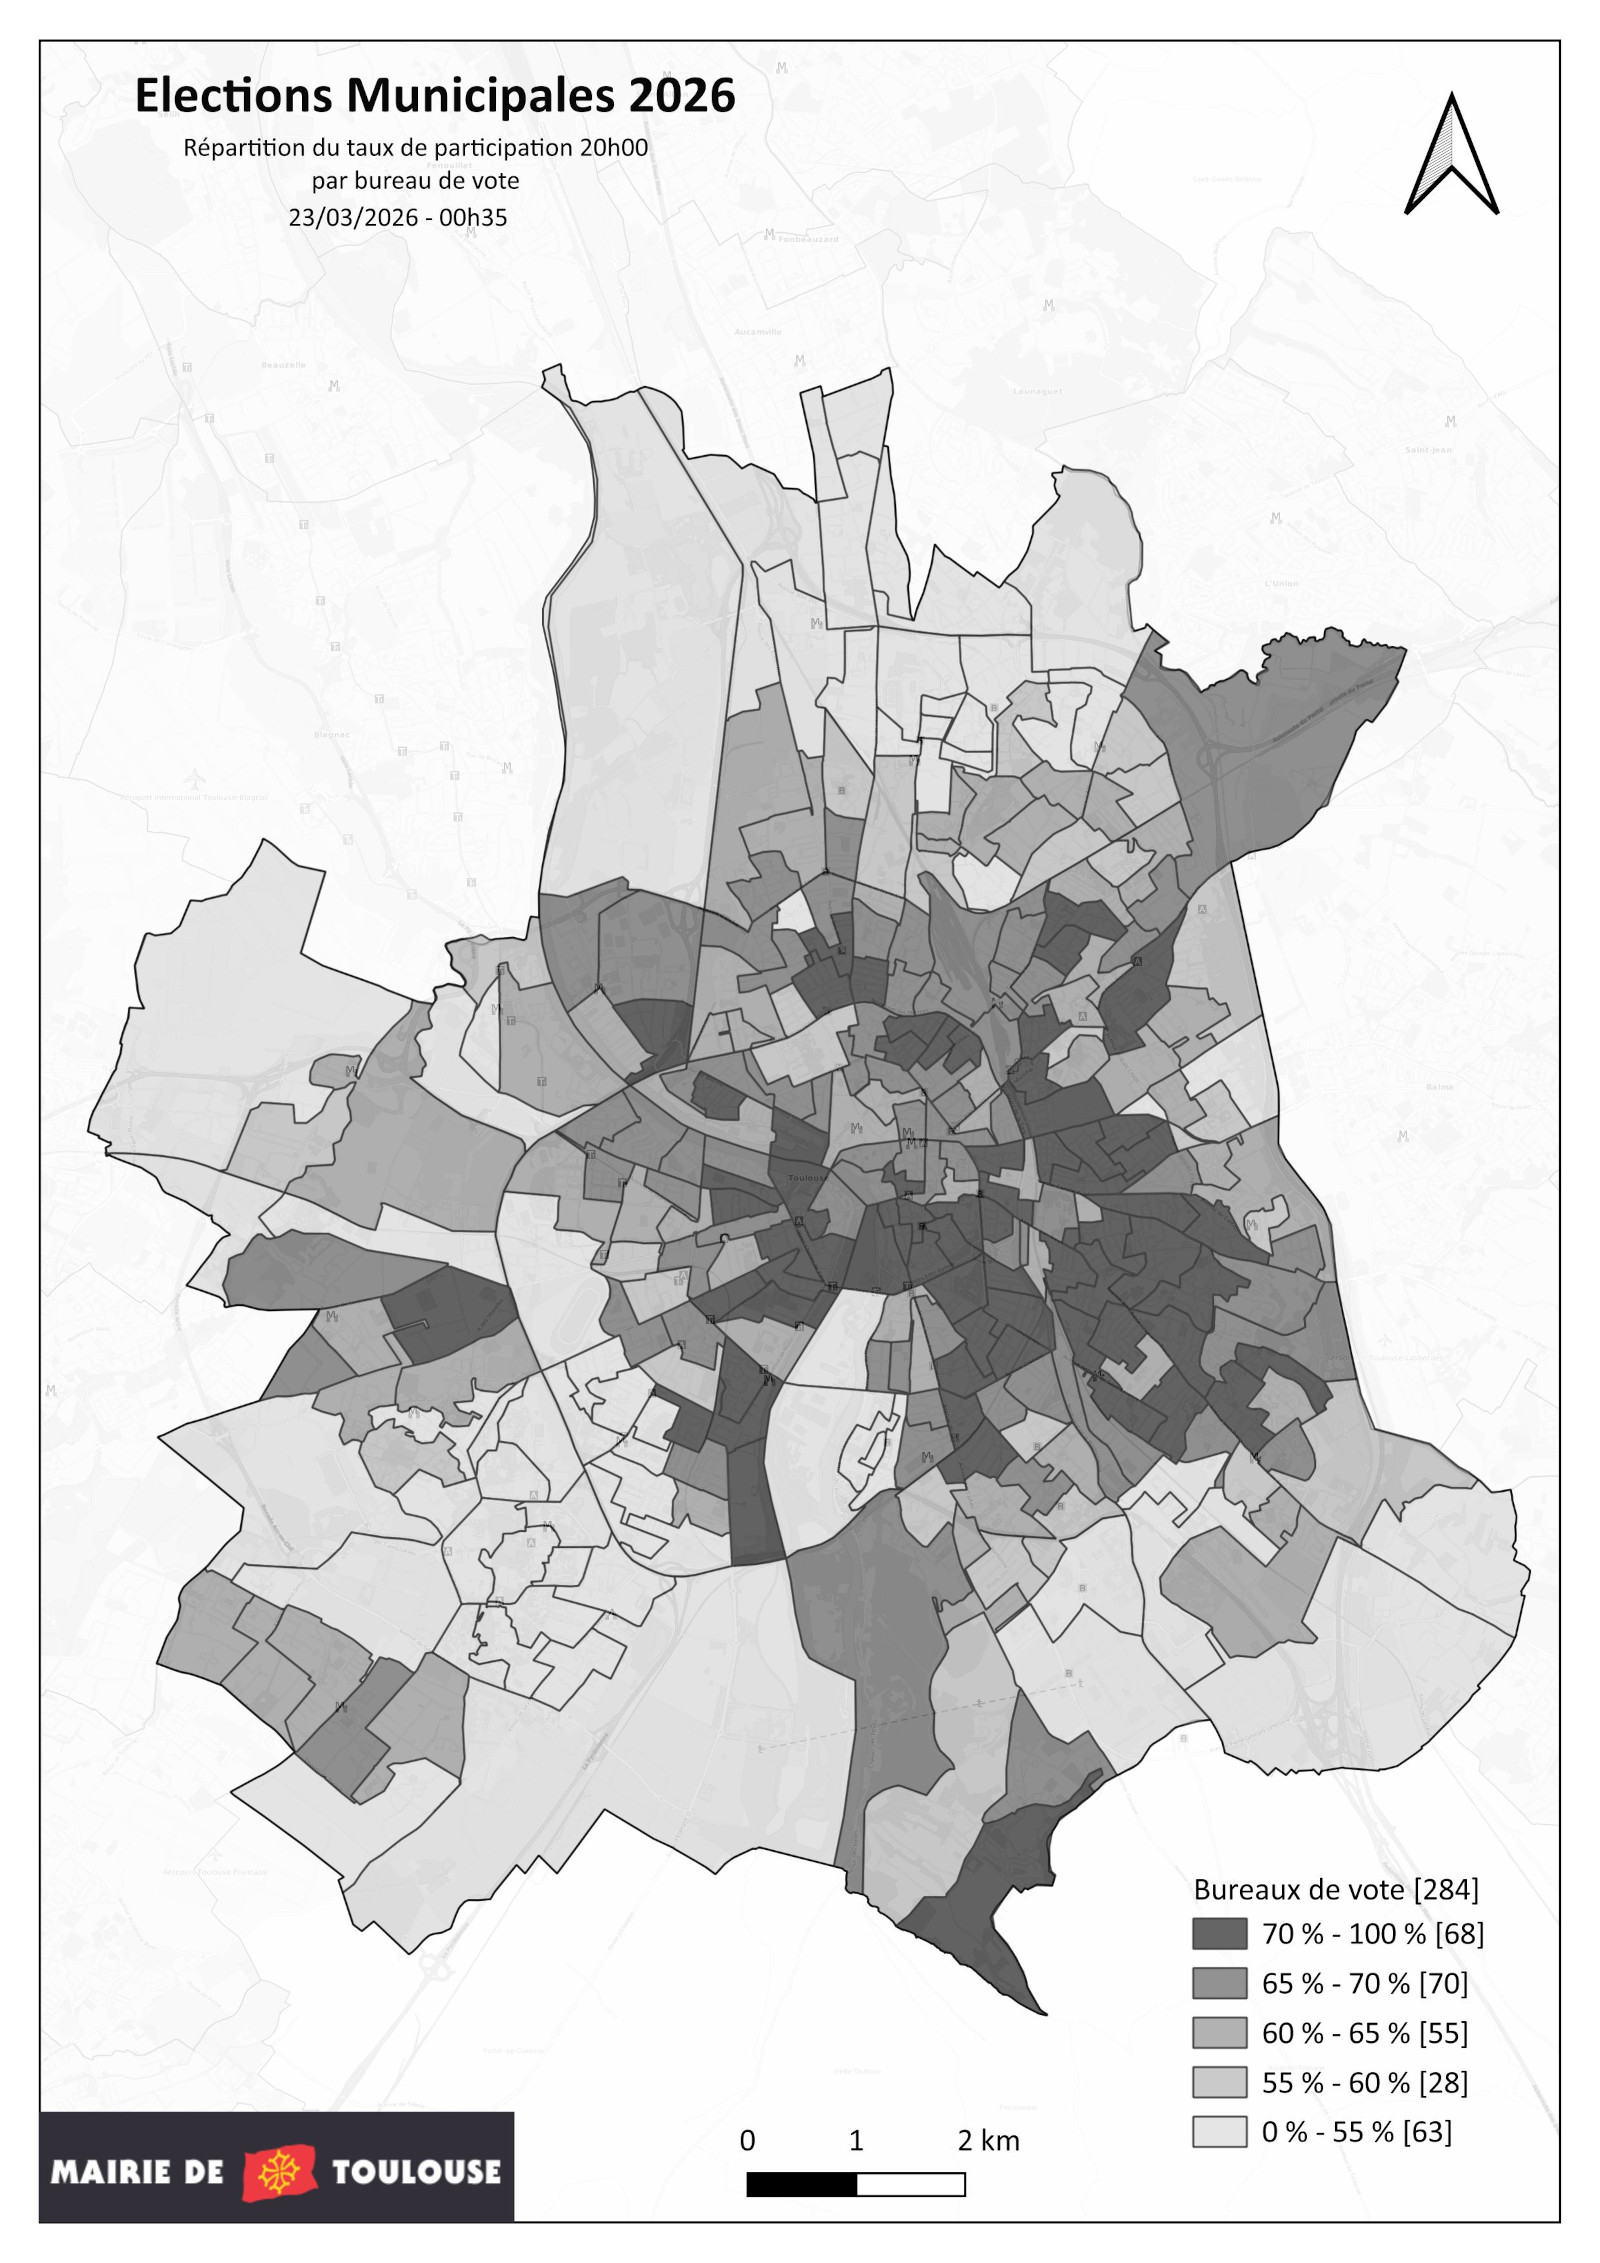
Les résultats à Toulouse et par bureau de vote
Dépouillement des bureaux de vote de Toulouse
Résultats : 285 sur 285 bureaux de vote dépouillés
| Inscrits | Votants | Blancs | Nuls | Exprimés | Participation |
|---|---|---|---|---|---|
| 281 713 | 175 998 | 3 397 | 1 524 | 171 077 | 62,47 % |
| Inscrits | 281 713 | ||||
| Votants | 175 998 | ||||
| Blancs | 3 397 | ||||
| Nuls | 1 524 | ||||
| Exprimés | 171 077 | ||||
| Participation | 62,47 % |
Vous pouvez consulter les résultats détaillés par bureau de vote toulousain via l'onglet "Bureaux de vote" présent ci-dessus.
| Listes | Voix Voix | % exprimés |
|---|---|---|
|
AVEC JEAN-LUC MOUDENC, PROTÉGEONS L'AVENIR DE TOULOUSE MOUDENC Jean-Luc |
92 152 | 53,87 % |
|
DEMAIN TOULOUSE LA GAUCHE UNIE PIQUEMAL François |
78 925 | 46,13 % |
| Votants | Participation | |
|---|---|---|
| 11h30 | 55 592 | 19,73 % |
| 16h30 | 134 393 | 47,71 % |
| 20h00 | 175 998 | 62,47 % |
Dépouillement des bureaux de vote de Toulouse
Résultats : 285 sur 285 bureaux de vote dépouillés
| Inscrits | Votants | Blancs | Nuls | Exprimés | Participation |
|---|---|---|---|---|---|
| 281 713 | 175 998 | 3 397 | 1 524 | 171 077 | 62,47 % |
| Inscrits | 281 713 | ||||
| Votants | 175 998 | ||||
| Blancs | 3 397 | ||||
| Nuls | 1 524 | ||||
| Exprimés | 171 077 | ||||
| Participation | 62,47 % |