Retour aux scrutins
Présidentielle 2017

Présidentielle 2017
Second tour
Les résultats à Toulouse et par bureau de vote
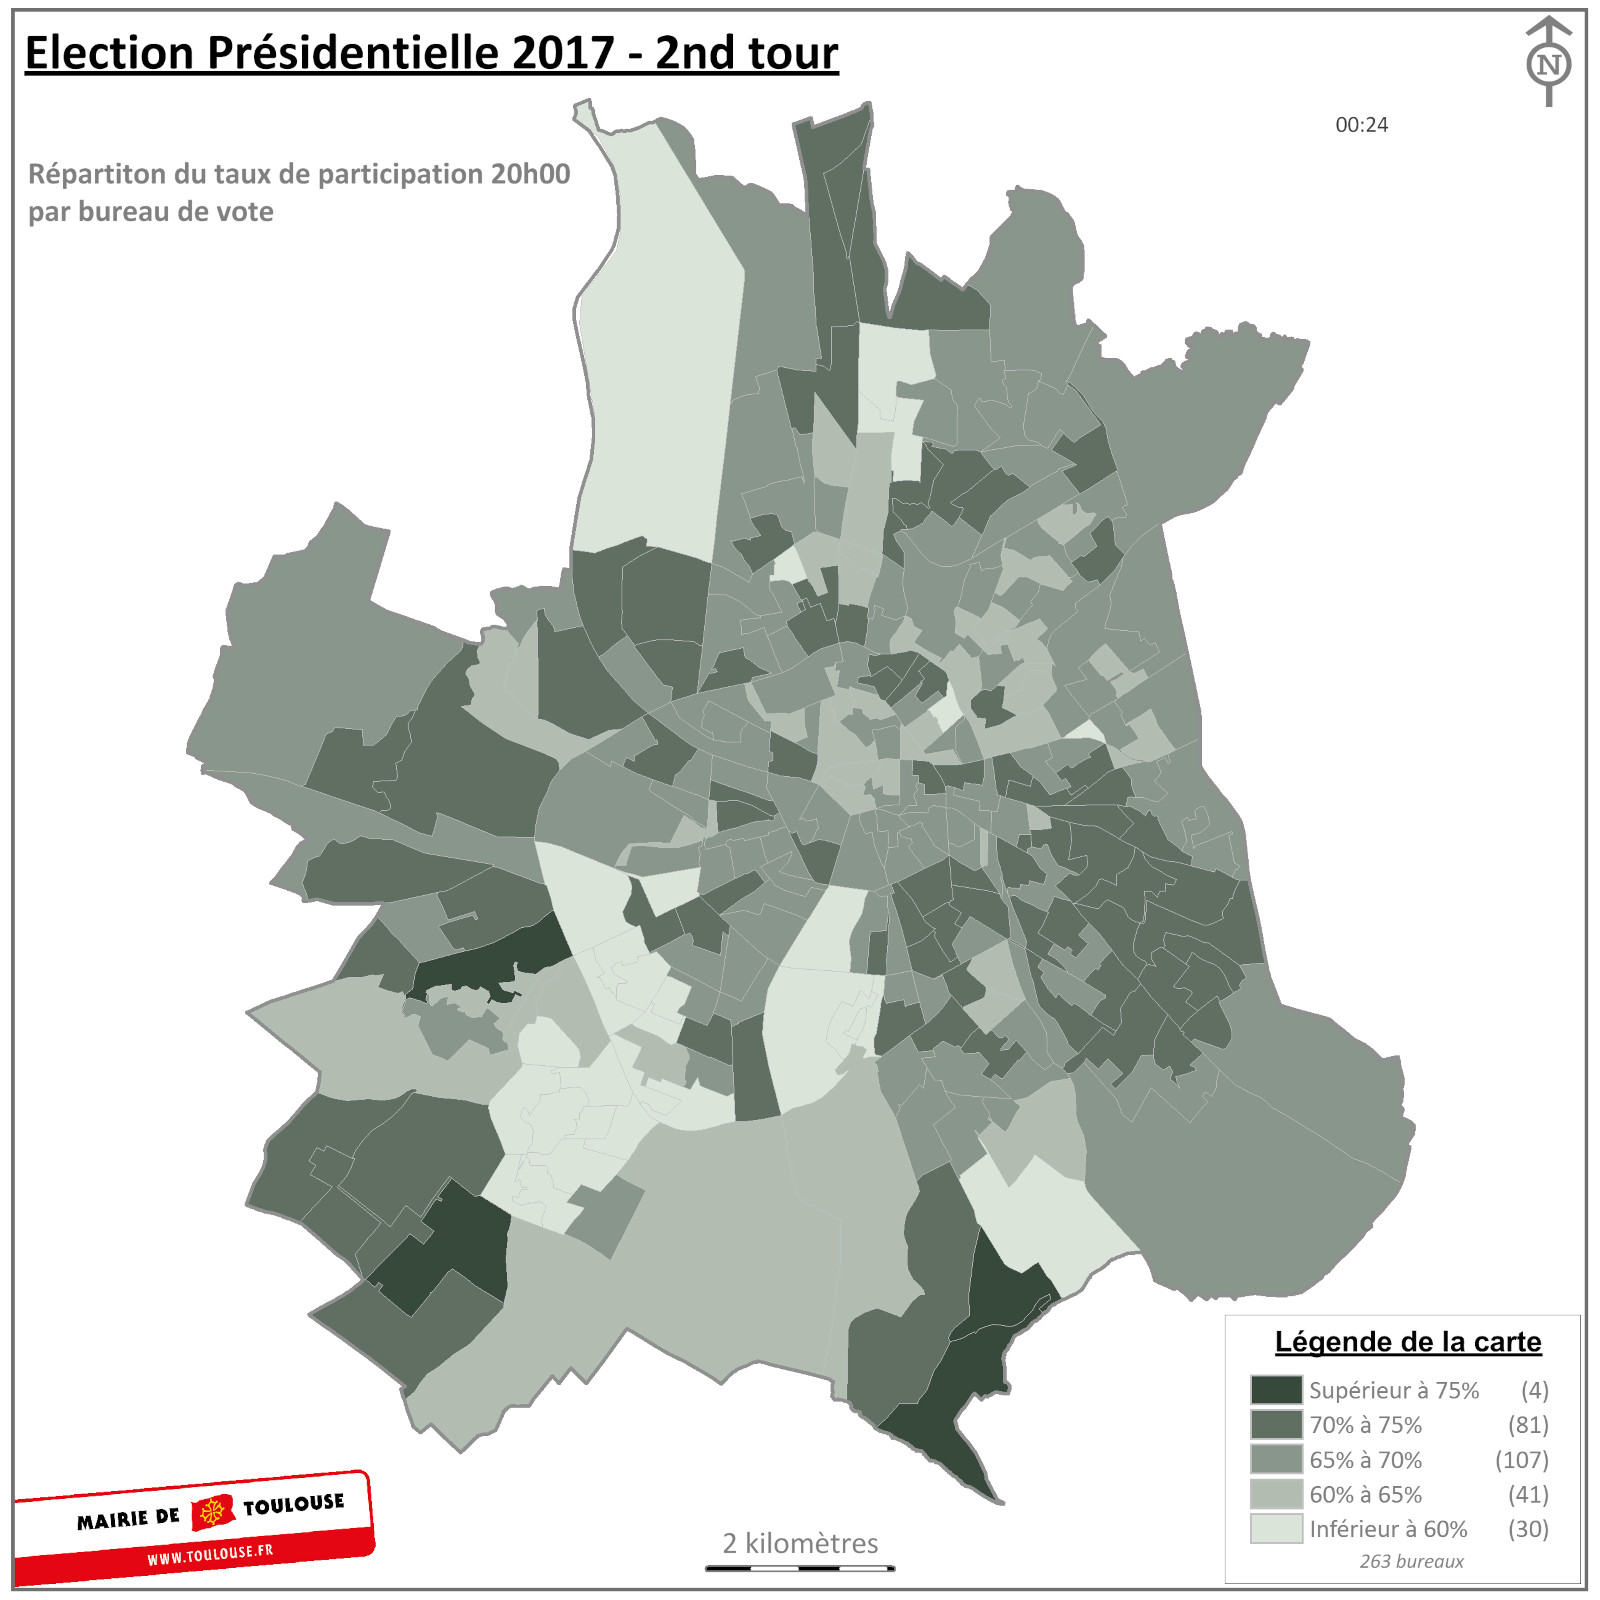
Dépouillement des bureaux de vote de Toulouse
Résultats définitifs : 263 sur 263 bureaux de vote dépouillés
| Inscrits | Votants | Blancs | Nuls | Exprimés | Participation |
|---|---|---|---|---|---|
| 268 849 | 181 192 | 14 571 | 4 723 | 161 898 | 67,40 % |
| Inscrits | 268 849 | ||||
| Votants | 181 192 | ||||
| Blancs | 14 571 | ||||
| Nuls | 4 723 | ||||
| Exprimés | 161 898 | ||||
| Participation | 67,40 % |
Vous pouvez consulter les résultats détaillés par bureau de vote toulousain via l'onglet "Bureaux de vote" présent ci-dessus.
| Candidats | Nb. Voix Voix | Pourcentage Pourc. |
|---|---|---|
| MARINE LE PEN | 27 572 | 17,03 % |
| EMMANUEL MACRON | 134 326 | 82,97 % |
| Votants | Participation | |
|---|---|---|
| 11h30 | 63 681 | 23,69 % |
| 16h30 | 139 742 | 51,98 % |
| 18h00 | 161 466 | 60,06 % |
| 20h00 | 181 192 | 67,40 % |
Dépouillement des bureaux de vote de Toulouse
Résultats définitifs : 263 sur 263 bureaux de vote dépouillés
| Inscrits | Votants | Blancs | Nuls | Exprimés | Participation |
|---|---|---|---|---|---|
| 268 849 | 181 192 | 14 571 | 4 723 | 161 898 | 67,40 % |
| Inscrits | 268 849 | ||||
| Votants | 181 192 | ||||
| Blancs | 14 571 | ||||
| Nuls | 4 723 | ||||
| Exprimés | 161 898 | ||||
| Participation | 67,40 % |