Retour aux scrutins
Présidentielle 2022

Présidentielle 2022
Premier tour
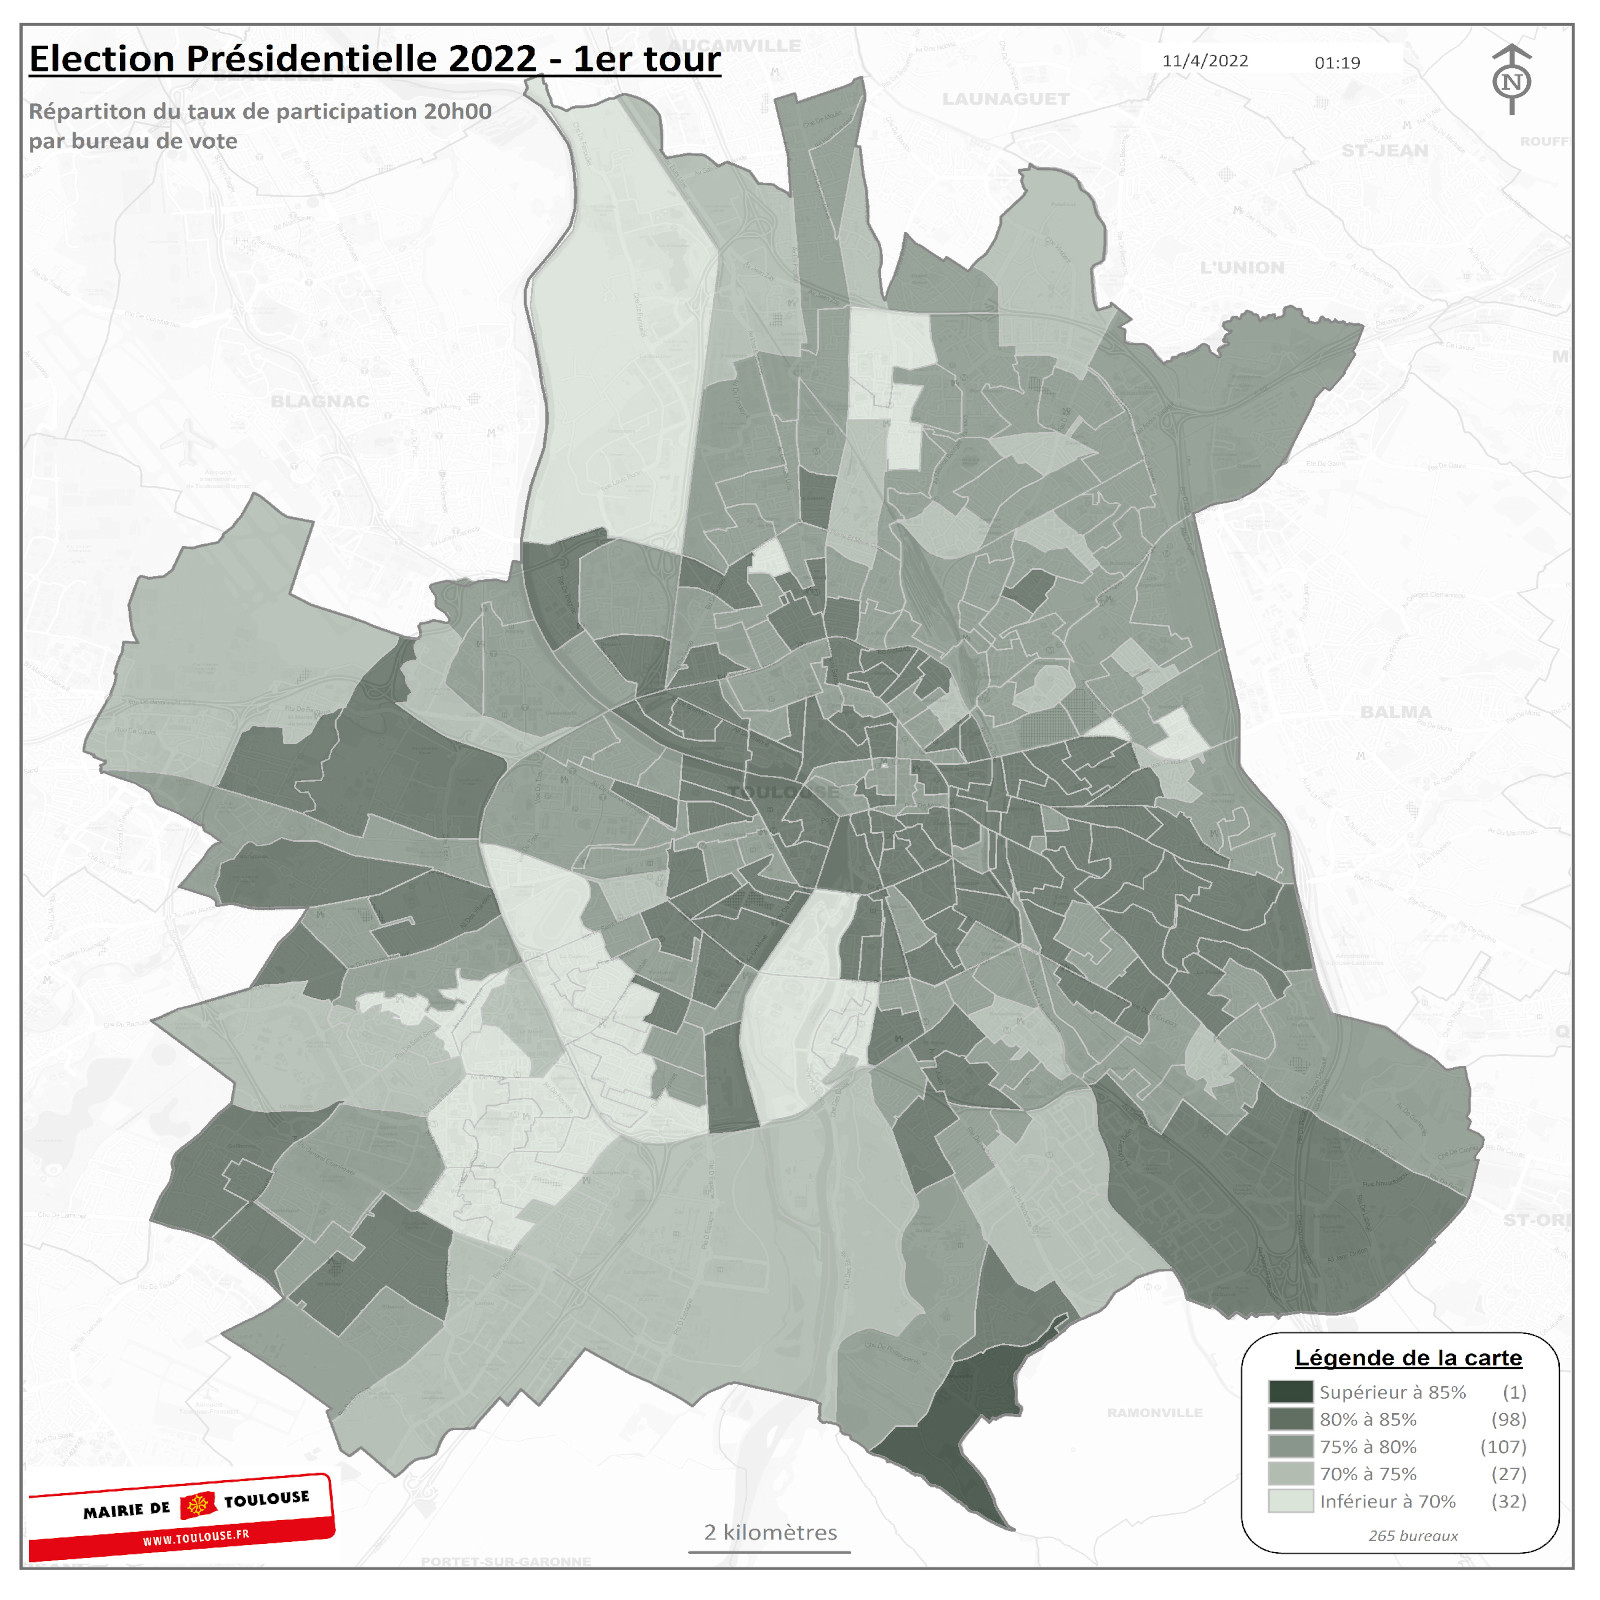
Les résultats à Toulouse et par bureau de vote
Dépouillement des bureaux de vote de Toulouse
Résultats définitifs : 265 sur 265 bureaux de vote dépouillés
| Inscrits | Votants | Blancs | Nuls | Exprimés | Participation |
|---|---|---|---|---|---|
| 258 771 | 200 207 | 2 392 | 900 | 196 915 | 77,37 % |
| Inscrits | 258 771 | ||||
| Votants | 200 207 | ||||
| Blancs | 2 392 | ||||
| Nuls | 900 | ||||
| Exprimés | 196 915 | ||||
| Participation | 77,37 % |
Vous pouvez consulter les résultats détaillés par bureau de vote toulousain via l'onglet "Bureaux de vote" présent ci-dessus.
| Candidats | Nb. Voix Voix | Pourcentage Pourc. |
|---|---|---|
| NATHALIE ARTHAUD | 647 | 0,33 % |
| FABIEN ROUSSEL | 4 085 | 2,07 % |
| EMMANUEL MACRON | 51 972 | 26,39 % |
| JEAN LASSALLE | 5 283 | 2,68 % |
| MARINE LE PEN | 18 810 | 9,55 % |
| ÉRIC ZEMMOUR | 12 599 | 6,40 % |
| JEAN-LUC MÉLENCHON | 72 764 | 36,95 % |
| ANNE HIDALGO | 5 049 | 2,56 % |
| YANNICK JADOT | 14 455 | 7,34 % |
| VALÉRIE PÉCRESSE | 7 489 | 3,80 % |
| PHILIPPE POUTOU | 1 402 | 0,71 % |
| NICOLAS DUPONT-AIGNAN | 2 360 | 1,20 % |
| Votants | Participation | |
|---|---|---|
| 11h30 | 60 774 | 23,49 % |
| 16h30 | 154 250 | 59,61 % |
| 20h00 | 200 207 | 77,37 % |
Dépouillement des bureaux de vote de Toulouse
Résultats définitifs : 265 sur 265 bureaux de vote dépouillés
| Inscrits | Votants | Blancs | Nuls | Exprimés | Participation |
|---|---|---|---|---|---|
| 258 771 | 200 207 | 2 392 | 900 | 196 915 | 77,37 % |
| Inscrits | 258 771 | ||||
| Votants | 200 207 | ||||
| Blancs | 2 392 | ||||
| Nuls | 900 | ||||
| Exprimés | 196 915 | ||||
| Participation | 77,37 % |