Retour
Régionales 2021

Régionales 2021
Premier tour
Les résultats à Toulouse et par bureau de vote
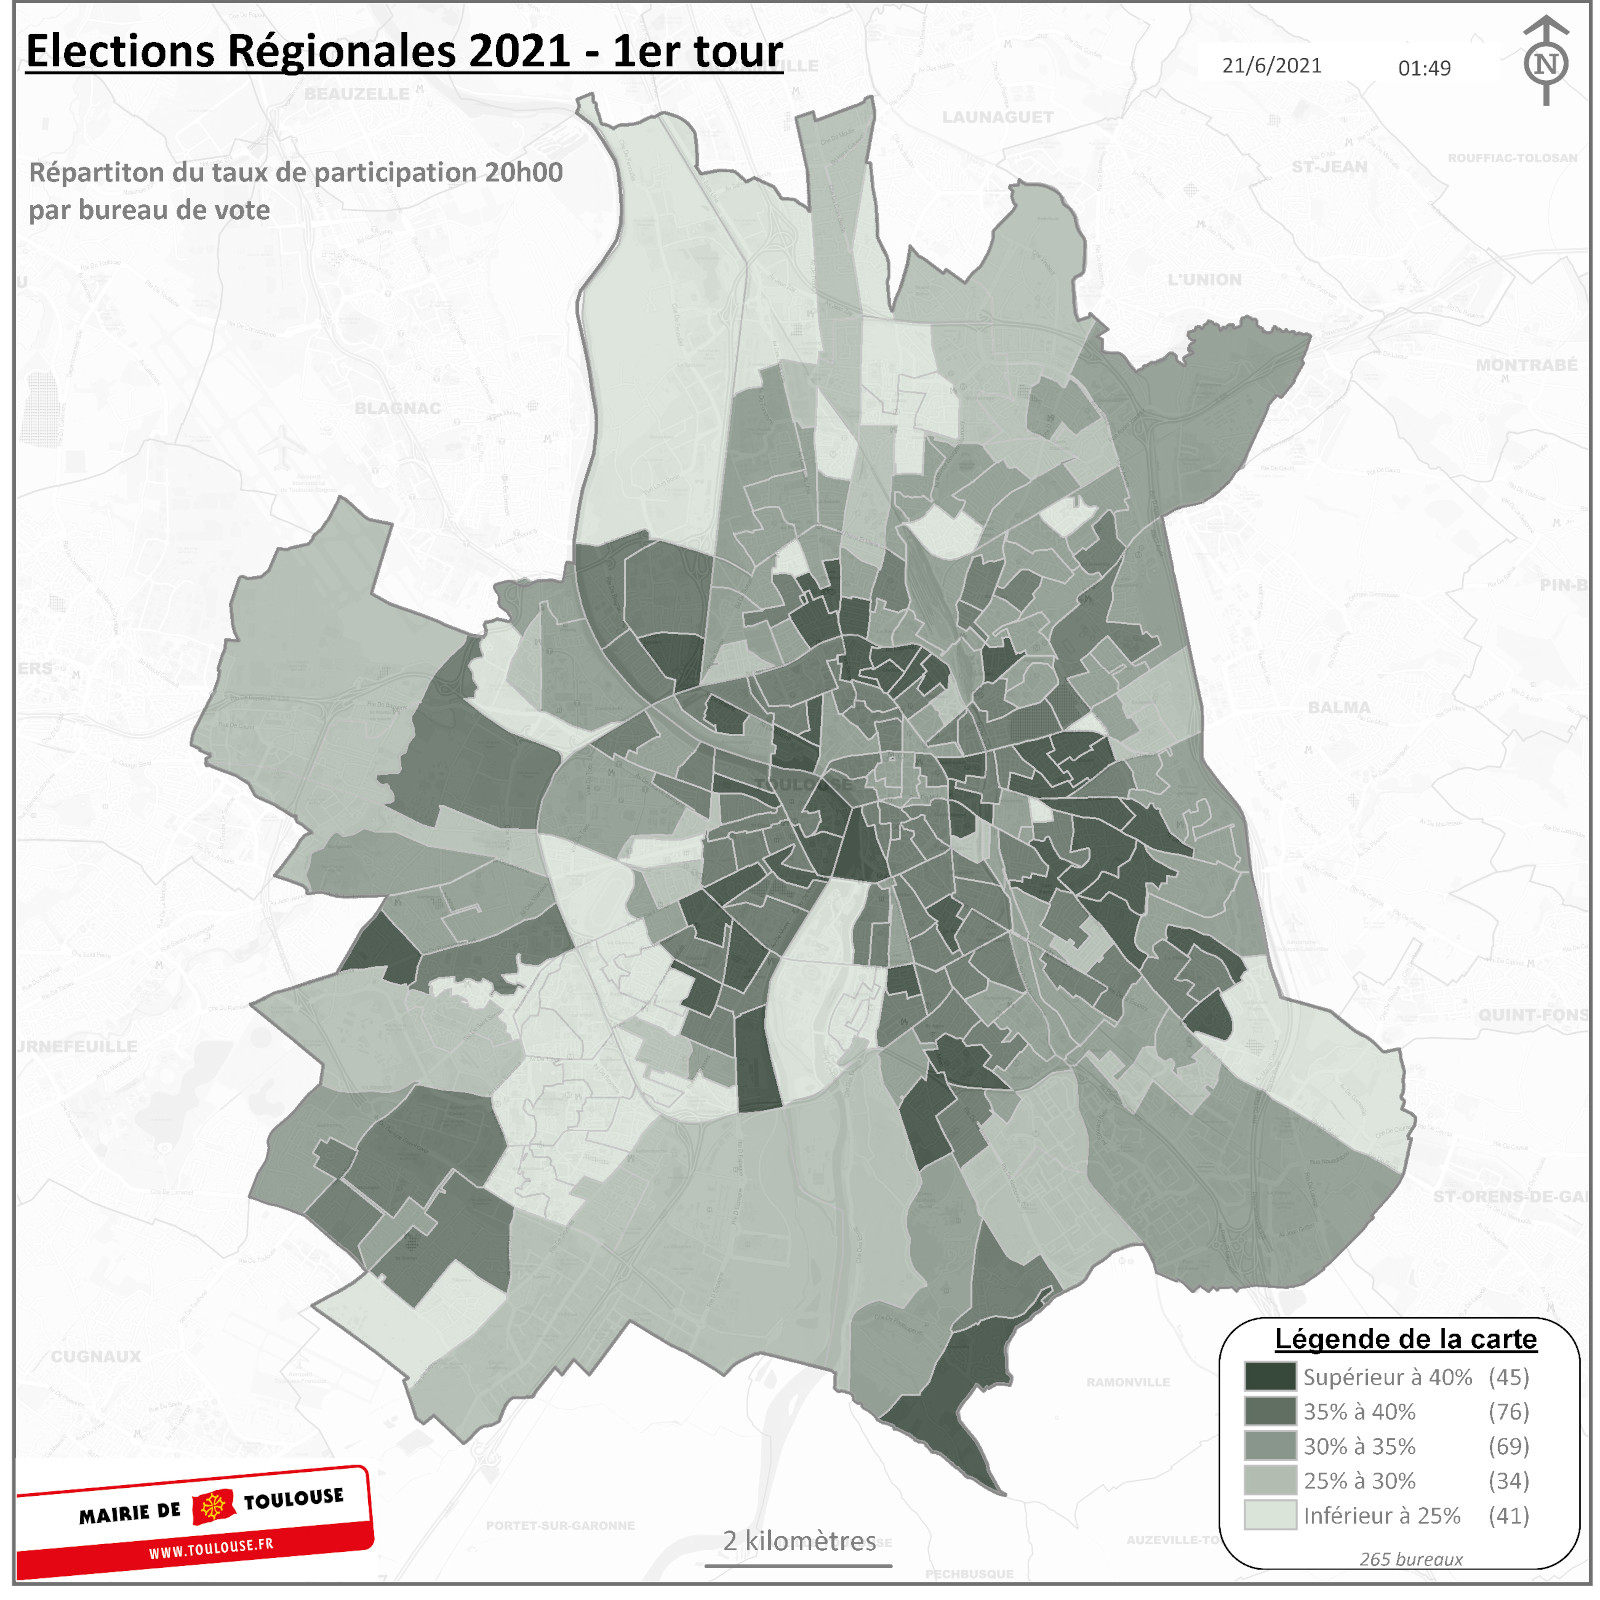
Dépouillement des bureaux de vote de Toulouse
Résultats : 265 sur 265 bureaux de vote dépouillés
| Inscrits | Votants | Blancs | Nuls | Exprimés | Participation |
|---|---|---|---|---|---|
| 244 929 | 80 904 | 708 | 725 | 79 471 | 33,03 % |
| Inscrits | 244 929 | ||||
| Votants | 80 904 | ||||
| Blancs | 708 | ||||
| Nuls | 725 | ||||
| Exprimés | 79 471 | ||||
| Participation | 33,03 % |
Vous pouvez consulter les résultats détaillés par bureau de vote toulousain via l'onglet "Bureaux de vote" présent ci-dessus.

| Listes / Candidats | Voix Voix | % exprimés |
|---|---|---|
|
RASSEMBLER L'OCCITANIE GARRAUD Jean-Paul |
8 899 | 11,20 % |
|
OCCITANIE POPULAIRE MARTIN Myriam |
6 570 | 8,27 % |
|
BASTIR OCCITANIE DAVEZAC Jean-Luc |
449 | 0,56 % |
|
DU COURAGE POUR L'OCCITANIE PRADIÉ Aurélien |
9 733 | 12,25 % |
|
NOUVEL ÉLAN POUR L'OCCITANIE TERRAIL-NOVES Aurélien |
9 398 | 11,83 % |
|
L'OCCITANIE NATURELLEMENT MAURICE Antoine |
13 921 | 17,52 % |
|
L'OCCITANIE EN COMMUN AVEC CAROLE DELGA DELGA Carole |
29 290 | 36,86 % |
|
LUTTE OUVRIÈRE - FAIRE ENTENDRE LE CAMP DES TRAVAILLEURS ADRADA Malena |
996 | 1,25 % |
|
UNION ESSENTIELLE LE BOURSICAUD Anthony |
215 | 0,27 % |
Dépouillement des bureaux de vote de Toulouse
Résultats : 265 sur 265 bureaux de vote dépouillés
| Inscrits | Votants | Blancs | Nuls | Exprimés | Participation |
|---|---|---|---|---|---|
| 244 929 | 80 904 | 708 | 725 | 79 471 | 33,03 % |
| Inscrits | 244 929 | ||||
| Votants | 80 904 | ||||
| Blancs | 708 | ||||
| Nuls | 725 | ||||
| Exprimés | 79 471 | ||||
| Participation | 33,03 % |

