Retour
Régionales 2021

Régionales 2021
Second tour
Les résultats à Toulouse et par bureau de vote
Dépouillement des bureaux de vote de Toulouse
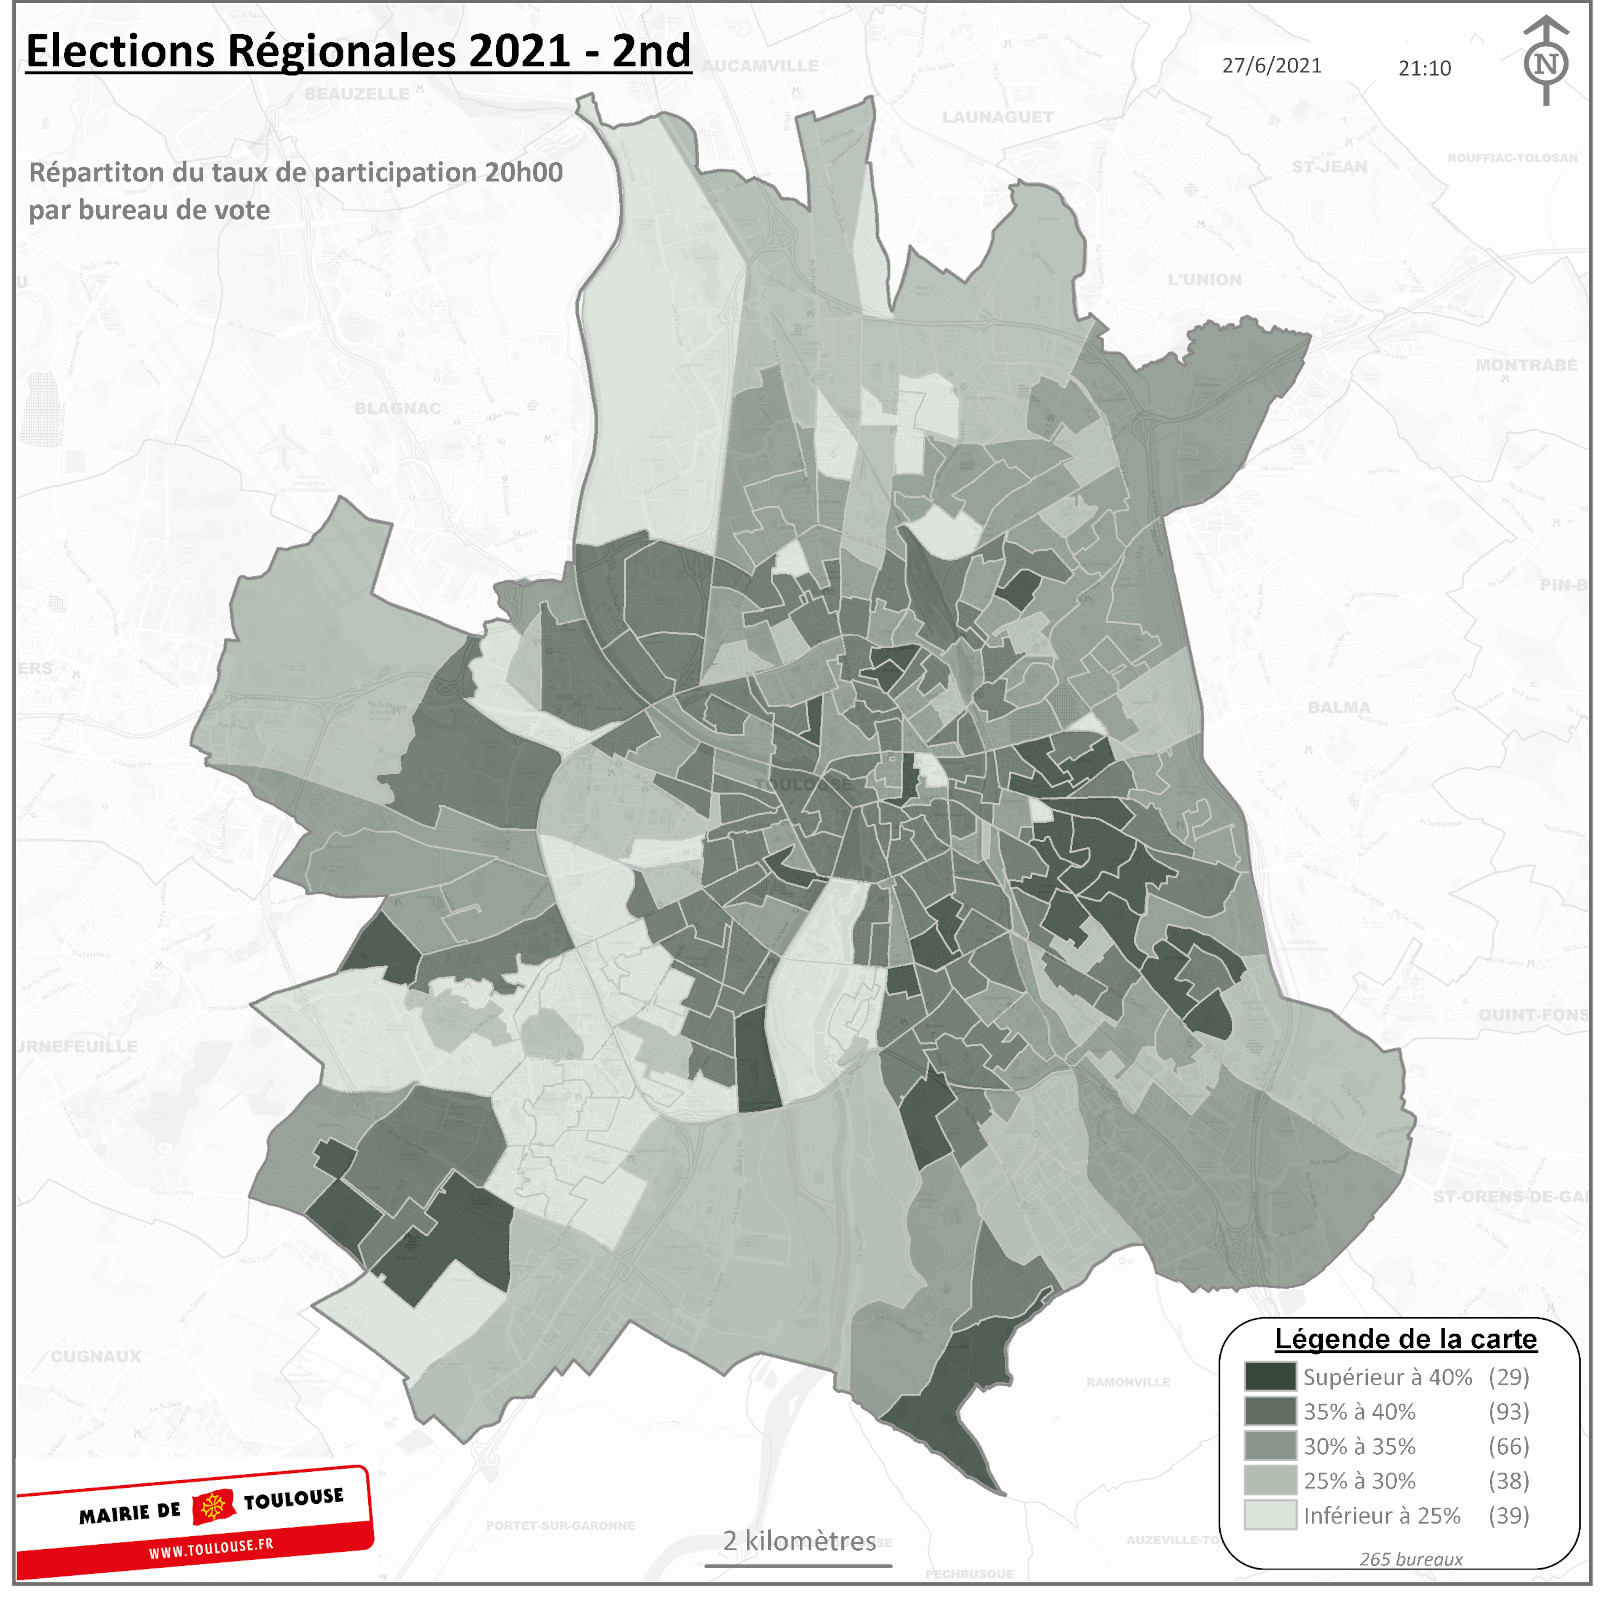
Résultats : 265 sur 265 bureaux de vote dépouillés
| Inscrits | Votants | Blancs | Nuls | Exprimés | Participation |
|---|---|---|---|---|---|
| 244 960 | 80 816 | 2 065 | 1 087 | 77 664 | 32,99 % |
| Inscrits | 244 960 | ||||
| Votants | 80 816 | ||||
| Blancs | 2 065 | ||||
| Nuls | 1 087 | ||||
| Exprimés | 77 664 | ||||
| Participation | 32,99 % |
Vous pouvez consulter les résultats détaillés par bureau de vote toulousain via l'onglet "Bureaux de vote" présent ci-dessus.

| Listes / Candidats | Voix Voix | % exprimés |
|---|---|---|
|
RASSEMBLER L'OCCITANIE GARRAUD Jean-Paul |
9 121 | 11,74 % |
|
DU COURAGE POUR L'OCCITANIE PRADIÉ Aurélien |
15 828 | 20,38 % |
|
L'OCCITANIE EN COMMUN AVEC CAROLE DELGA DELGA Carole |
52 715 | 67,88 % |
Dépouillement des bureaux de vote de Toulouse
Résultats : 265 sur 265 bureaux de vote dépouillés
| Inscrits | Votants | Blancs | Nuls | Exprimés | Participation |
|---|---|---|---|---|---|
| 244 960 | 80 816 | 2 065 | 1 087 | 77 664 | 32,99 % |
| Inscrits | 244 960 | ||||
| Votants | 80 816 | ||||
| Blancs | 2 065 | ||||
| Nuls | 1 087 | ||||
| Exprimés | 77 664 | ||||
| Participation | 32,99 % |

